

Do you know how much electricity your household uses? A community in Nottingham is being provided with monthly energy reports for their electricity consumption. The reports offer an opportunity for home occupants to increase awareness about their consumption, identify ways to reduce it, and discover ways to implement changes to optimise energy expenditure.
This is not a new concept; occupants have long been able to review their energy usage through their bills and smart meters. Yet improving our understanding of energy consumption in the household is important. According to Office of Gas and Electricity Markets (Ofgem), households are estimated to consume on average 2,900 kWh of electricity annually. That would be approximately 242 kWh monthly and 8 kWh daily. However, many people are still unaware how those energy electrons are actually used within the homes.
The University of Nottingham (UoN) Research team, Faculty of Engineering, is monitoring the electrical energy consumption and indoor environmental conditions of households at Trent Basin, a community energy scheme of low-energy houses, situated on the banks of the River Trent, in Nottingham. The monitoring to date includes 26 properties and collects data from community energy assets which include a 2.1MWh community battery and 200KWp community photovoltaic panels. The monitoring also includes data from an onsite weather station which records temperature, humidity, wind speed and direction, rainfall, and solar irradiance (global horizontal, diffuse and direct). This has enabled a truly holistic approach to data analysis at Trent Basin.
The monitored properties benefit from a bespoke in-home kit that enables remote room level control of the heating system, monitoring of indoor environmental conditions (e.g., temperature, humidity, and carbon dioxide levels), total electricity consumption and, in more recent properties, hot water and space heating. The electrical consumption is also measured through sensors installed on individual electrical circuits within the house which provide disaggregated energy usage data. This is providing the opportunity to feed back to the residents about where energy is being used (e.g., EV chargers, lighting, sockets, significant appliances) as well the timeframe and the magnitude of the consumption. Importantly, this feedback is enabling households to make informed decisions and trial ways to reduce their overall energy consumption.
Energy reports
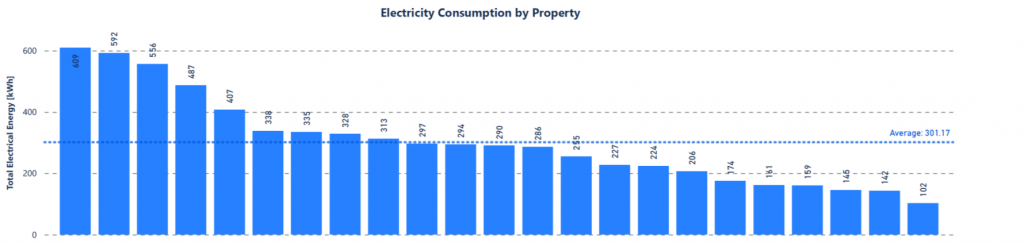
The data is now being used by the UoN Research team to provide personalised monthly energy reports for the participating households. The reports were created using an in-house developed semi-automatic platform using PowerBi software and data storage in the cloud. To date, the monthly reports have been produced for each home for over two years of continuous monitoring. The reports are 10-pages long and provide detailed energy data at community level (generated, stored, and consumed) as well as a breakdown of data at a property level in terms of occupancy, environmental conditions, and energy usage in each corresponding month (Figure 1). This enables residents to identify and implement changes in their behaviour, then monitor the results with a view to reducing their electricity consumption. Residents can also access the live data through a web portal and Amazon Alexa skills developed by the UoN team for the project.
Engaging and acting
During regular engagements with residents, the UoN Research team helped one resident who wanted to find out more about their consumption. It was unclear which equipment was causing a consistently high electricity consumption in the property. The resident identified the potential equipment responsible: towel-rails in the bathrooms which were constantly left on. The resident has taken to managing the use of the towel rails more effectively, along with other minor changes, such as unplugging equipment from sockets when they were not in use and monitoring when turning appliances on (e.g., washing machine).
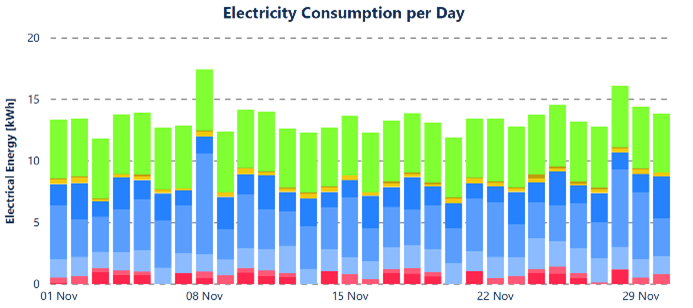
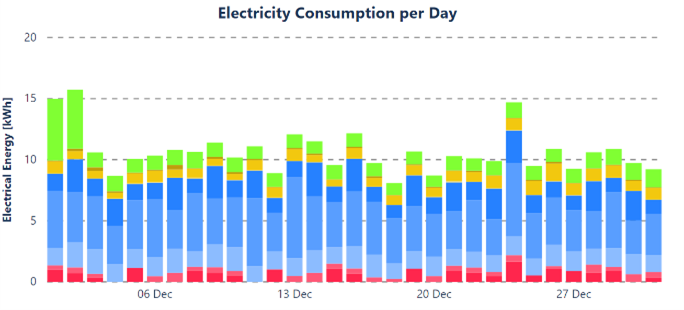
The result of these changes was clear to see in the following monthly energy report. The corresponding electrical circuit (marked in green in Figure 2 above) had a daily reduction from nearly 5kWh/day to 1-1.5 kWh/day. This corresponded to a reduction from around 150 kWh to less than 50 kWh a month in the corresponding circuit. The household had its overall monthly electricity consumption reduced from 408 kWh to 335 kWh, a 15% reduction as a direct result of the changes made. This would correspond to yearly cost savings of over £125 based on the 2019 average unit rate of electricity in the UK of 14.4p per kWh.
“From our end, having received the reports, allowed us to act immediately and drop our electricity energy consumption by around 15%. This is something that was completely oblivious to us before, so having had the access to the information definitely highlighted some opportunities we could address.”
– Trent Basin Resident, about the energy reports developed by the UoN Research team
Dr Renata Tubelo is a Research Fellow in the Buildings, Energy and Environment Research Group at the University of Nottingham’s Faculty of Engineering.